Bibliographie
-
Google Scholar, H-INDEX 26, 3157 Citations scholar
-
DBLP, Computer Science Bibliograpy dblp
-
HAL Science Ouverte CNRS hal
Sélection de publications
Deep Neural Network for DrawiNg Networks, (DNN)^2
Loann Giovannangeli, Frederic Lalanne, David Auber, Romain Giot, Romain Bourqui
International Symposium on Graph Drawing and Network Visualization (GD 2021)
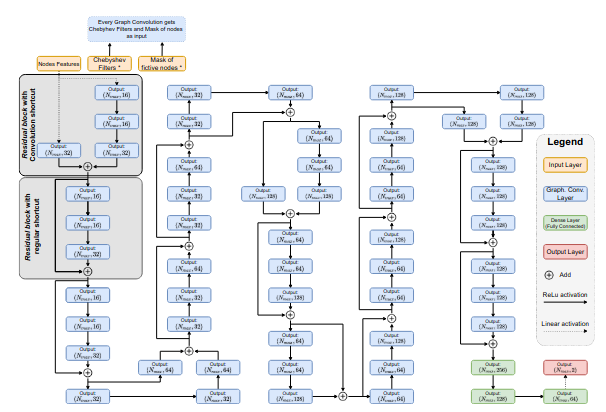
By leveraging recent progress of stochastic gradient descent methods, several works have shown that graphs could be efficiently laid out through the optimization of a tailored objective function. In the meantime, Deep Learning (DL) techniques achieved great performances in many applications. We demonstrate that it is possible to use DL techniques to learn a graph-to-layout sequence of operations thanks to a graph-related objective function. In this paper, we present a novel graph drawing framework called (DNN)^2: Deep Neural Network for DrawiNg Networks. Our method uses Graph Convolution Networks to learn a model. Learning is achieved by optimizing a graph topology related loss function that evaluates (DNN)^2 generated layouts during training. Once trained, the (DNN)^ model is able to quickly lay any input graph out. We experiment (DNN)^2 and statistically compare it to optimization-based and regular graph layout algorithms. The results show that (DNN)^2 performs well and are encouraging as the Deep Learning approach to Graph Drawing is novel and many leads for future works are identified.
Edge-Path Bundling: A Less Ambiguous Edge Bundling Approach
Markus Wallinger, Daniel Archambault, David Auber, Martin Nöllenburg, Jaakko Peltonen
IEEE Transactions on Visualization and Computer Graphics (2021)
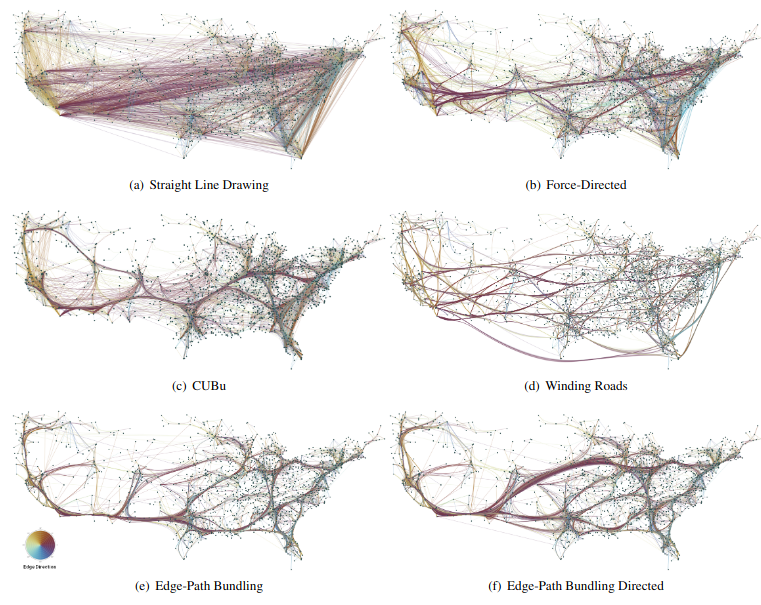
Edge bundling techniques cluster edges with similar attributes (i.e. similarity in direction and proximity) together to reduce the visual clutter. All edge bundling techniques to date implicitly or explicitly cluster groups of individual edges, or parts of them, together based on these attributes. These clusters can result in ambiguous connections that do not exist in the data. Confluent drawings of networks do not have these ambiguities, but require the layout to be computed as part of the bundling process. We devise a new bundling method, Edge-Path bundling, to simplify edge clutter while greatly reducing ambiguities compared to previous bundling techniques. Edge-Path bundling takes a layout as input and clusters each edge along a weighted, shortest path to limit its deviation from a straight line. Edge-Path bundling does not incur independent edge ambiguities typically seen in all edge bundling methods, and the level of bundling can be tuned through shortest path distances, Euclidean distances, and combinations of the two. Also, directed edge bundling naturally emerges from the model. Through metric evaluations, we demonstrate the advantages of Edge-Path bundling over other techniques.
HiePaCo: Scalable hierarchical exploration in abstract parallel coordinates under budget constraints
Gaëlle Richer, Joris Sansen, Frédéric Lalanne, David Auber, Romain Bourqui
Big Data Research (2020)
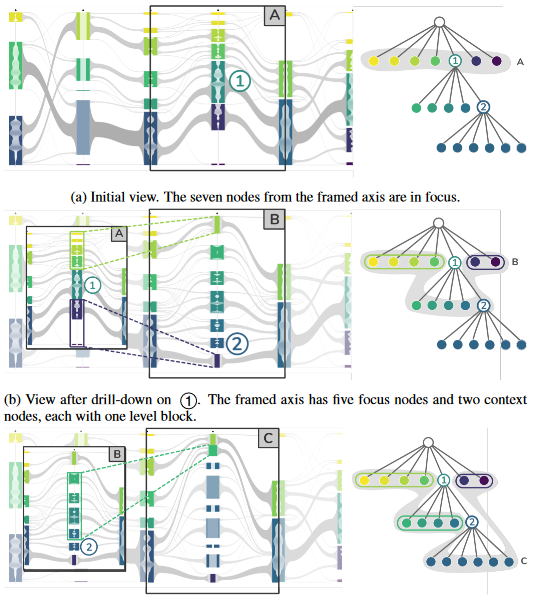
In exploratory visualization systems, interactions allow to manipulate a visual representation and thereby gain insight into its supporting data. The responsiveness of these interactions is crucial, but achieving it on common hardware becomes increasingly difficult with the ever-growing size of datasets. Moreover, the representation of a large dataset itself is challenging since screen space is limited and, past a certain size, the number of items exceeds the number of pixels available or may render the representation unhelpful. The focus of this paper is on multidimensional data and parallel coordinates. For the system to be scalable, we propose a multiscale representation based on hierarchical aggregation on the client-side and distributed computing on a horizontally scalable infrastructure on the server-side. Multiscale visualization builds on several levels of abstraction to provide interactive and incremental changes in the level of detail. Horizontal scalability refers to the ability to increase the resources of the computing infrastructure by connecting additional computers. This paper presents: (1) a graph-based formalism for describing multiscale representations of parallel coordinates and their interactions and (2) a client-server system with a focus+context representation for multiscale parallel coordinates and distributed computation on a remote data-intensive infrastructure. We leverage the proposed formalism to describe several design possibilities for usual interactions in parallel coordinates, hierarchical navigation, and edition. We illustrated the scalability and usage of the representation in a real-world case. Performance experiments demonstrate that on a 15-computer cluster, the prototype system can scale to billion-item datasets while preserving the interactivity for analysis.
Cornac: Tackling Huge Graph Visualization with Big Data Infrastructure
Alexandre Perrot, David Auber
IEEE Transactions on Big Data Journal (2018)
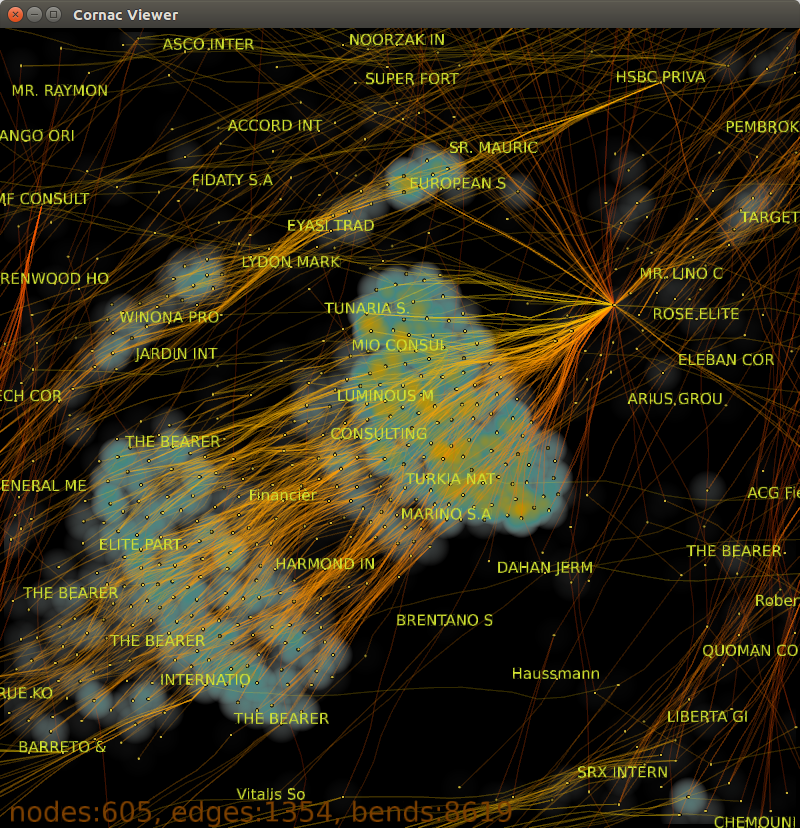
The size of available graphs has drastically increased in recent years. The real-time visualization of graphs with millions of edges is a challenge but is necessary to grasp information hidden in huge datasets. This article presents an end-to-end technique to visualize huge graphs using an established Big Data ecosystem and a lightweight client running in a Web browser. For that purpose, levels of abstraction and graph tiles are generated by a batch layer and the interactive visualization is provided using a serving layer and client-side real-time computation of edge bundling and graph splatting. A major challenge is to create techniques that work without moving data to an ad hoc system and that take advantage of the horizontal scalability of these infrastructures.
We introduce two novel scalable algorithms that enable to generate a canopy clustering and to aggregate graph edges. These two algorithms are both used to produce levels of abstraction and graph tiles. We prove that our technique guarantee a quality of visualization by controlling both the necessary bandwidth required for data transfer and the quality of the produced visualization.
Furthermore, we demonstrate the usability of our technique by providing a complete prototype. We present benchmarks on graphs with millions of elements and we compare our results to those obtained by state of the art techniques. Our results show that new Big Data technologies can be incorporated into visualization pipeline to push out the size limits of graphs one can visually analyze.
Livid : INTERACTIVE VISUALIZATION OF DENSITY FUNCTIONS ON BIG DATA INFRASTRUCTURES
Alexandre Perrot, Romain Bourqui, Nicolas Hanusse, Frédéric Lalanne, David Auber
IEEE Large Data Analysis And Visualization (Best Paper Award 2015)

Point set visualization is required in lots of visualization techniques. Scatter plots as well as geographic heat-maps are straightforward examples. Data analysts are now well trained to use such visualiza- tion techniques. The availability of larger and larger datasets raises the need to make these techniques scale as fast as the data grows. The Big Data Infrastructure offers the possibility to scale horizon- tally. Designing point set visualization methods that fit into that new paradigm is thus a crucial challenge. In this paper, we present a complete architecture which fully fits into the Big Data paradigm and so enables interactive visualization of heatmaps at ultra-scale. A new distributed algorithm for multi-scale aggregation of point set is given and an adaptive GPU based method for kernel density es- timation is proposed. A complete prototype working with Hadoop, HBase, Spark and WebGL has been implemented. We give a bench- mark of our solution on a dataset having more than 2 billion points.
GosperMap: Using a Gosper Curve for Laying out Hierarchical Data
David Auber, Charles Huet, Antoine Lambert, Benjamin Renoust, Arnaud Sallaberry, Agnes Saulnier
IEEE Transactions on Visualization and Computer Graphics (2013)
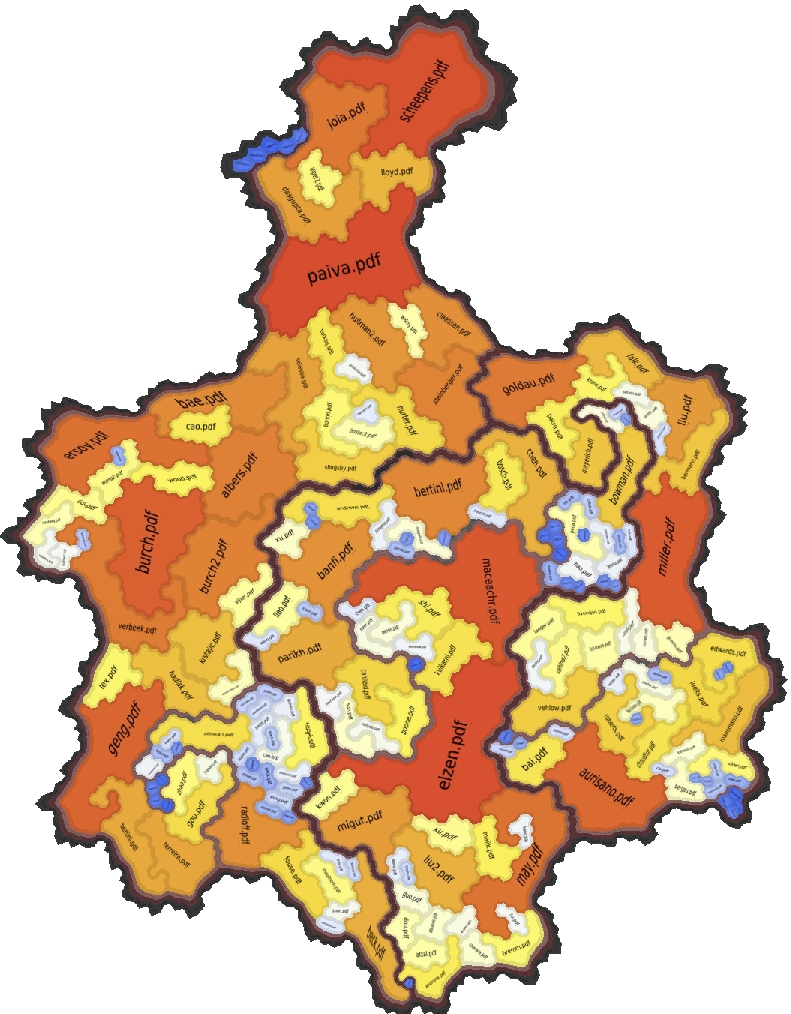
The emergence of very large hierarchies that result from the increase in available data raises many problems of visualization and navigation. On datasets of such scale, classical graph drawing methods do not take advantage of certain human cognitive skills such as shape recognition. These cognitive skills could make it easier to remember the global structure of the data. In this paper, we propose a method that is based on the use of nested irregular shapes. We name it GosperMap as we rely on the use of a Gosper Curve to generate these shapes. By employing human perception mechanisms that were developed by handling, for example, cartographic maps, this technique facilitates the visualization and navigation of a hierarchy. An algorithm has been designed to preserve region containment according to the hierarchy and to set the leaves’ sizes proportionally to a property, in such a way that the size of non-leaf regions corresponds to the sum of their children’s sizes. Moreover, the input ordering of the hierarchy’s nodes is preserved, i.e., the areas that represent two consecutive children of a node in the hierarchy are adjacent to one another. This property is especially useful because it guarantees some stability in our algorithm. We illustrate our technique by providing visualization examples of the repartition of tax money in the U.S. over time. Furthermore, we validated the use of the GosperMap in a professional documentation context. and show the stability and ease of memorization for this type of map.
Winding Roads: Routing edges into bundles
Antoine Lambert, Romain Bourqui, David Auber
Computer Graphics Forum (2010)
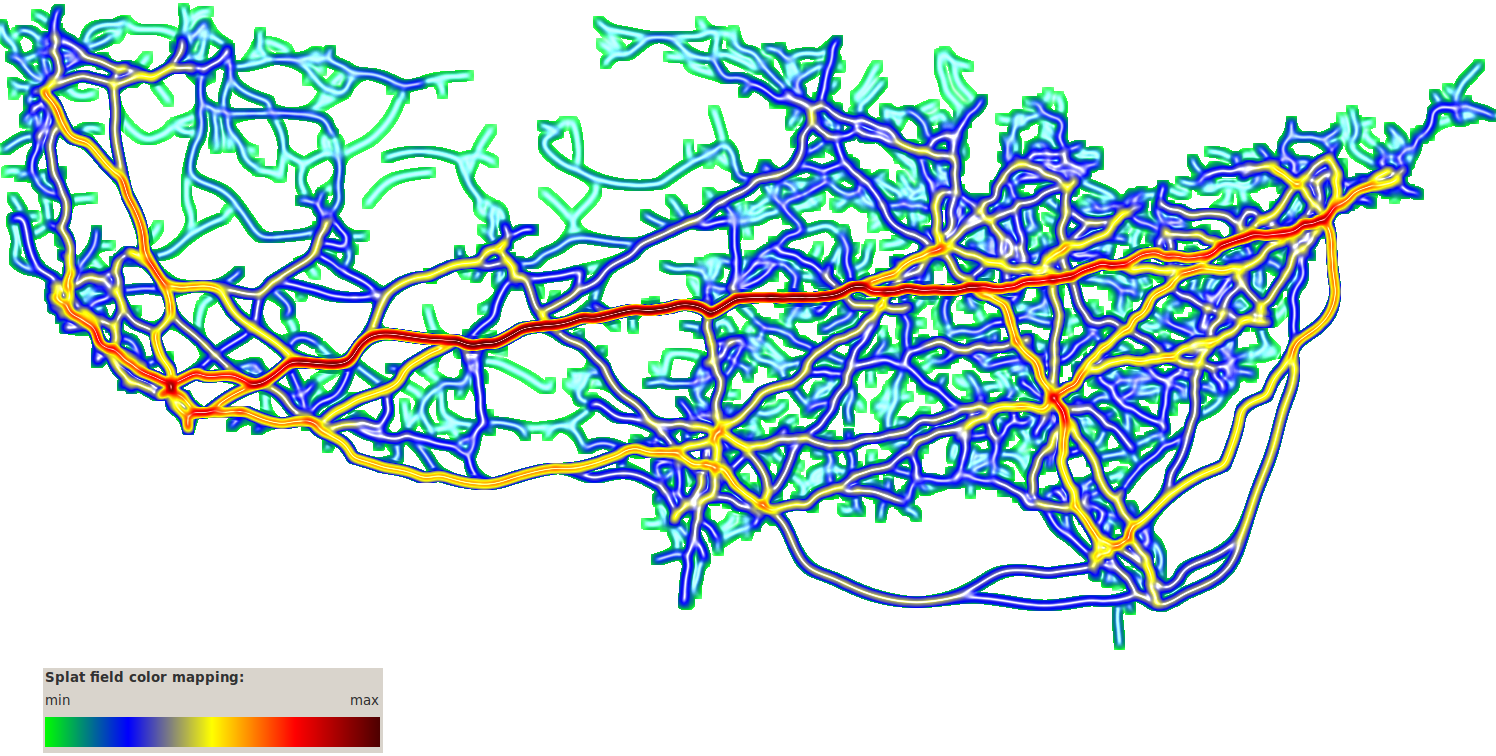
Visualizing graphs containing many nodes and edges efficiently is quite challenging. Drawings of such graphs generally suffer from visual clutter induced by the large amount of edges and their crossings. Consequently, it is difficult to read the relationships between nodes and the high-level edge patterns that may exist in standard node- link diagram representations. Edge bundling techniques have been proposed to help solve this issue, which rely on high quality edge rerouting. In this paper, we introduce an intuitive edge bundling technique which efficiently reduces edge clutter in graphs drawings. Our method is based on the use of a grid built using the original graph to compute the edge rerouting. In comparison with previously proposed edge bundling methods, our technique improves both the level of clutter reduction and the computation performance. The second contribution of this paper is a GPU-based rendering method which helps users perceive bundles densities while preserving edge color.
Tugging Graphs Faster: Efficiently Modifying Path-Preserving Hierarchies for Browsing Paths
Daniel Archambault, Tamara Munzner, David Auber
IEEE Transactions on Visualization and Computer Graphics (2010)
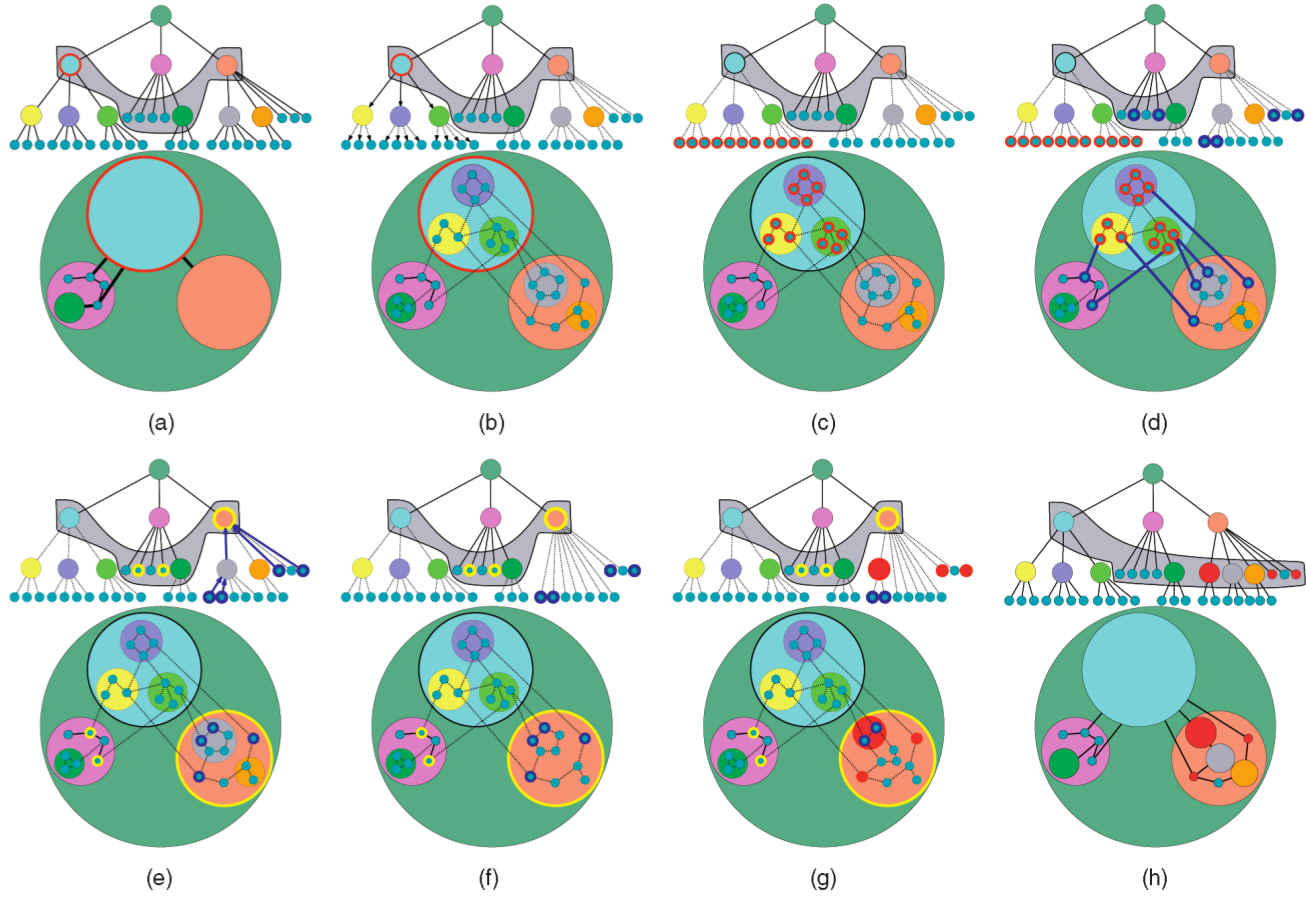
Many graph visualization systems use graph hierarchies to organize a large input graph into logical components. These approaches detect features globally in the data and place these features inside levels of a hierarchy. However, this feature detection is a global process and does not consider nodes of the graph near a feature of interest. TugGraph is a system for exploring paths and proximity around nodes and subgraphs in a graph. The approach modifies a pre-existing hierarchy in order to see how a node or subgraph of interest extends out into the larger graph. It is guaranteed to create path-preserving hierarchies, so that the abstraction shown is meaningful with respect to the underlying structure of the graph. The system works well on graphs of hundreds of thousands of nodes and millions of edges. TugGraph is able to present views of this proximal information in the context of the entire graph in seconds, and does not require a layout of the full graph as input.
Fully Automatic Visualisation of Overlapping Sets
Paolo Simonetto, David Auber, Daniel Archambault
Computer Graphics Forum (2009)
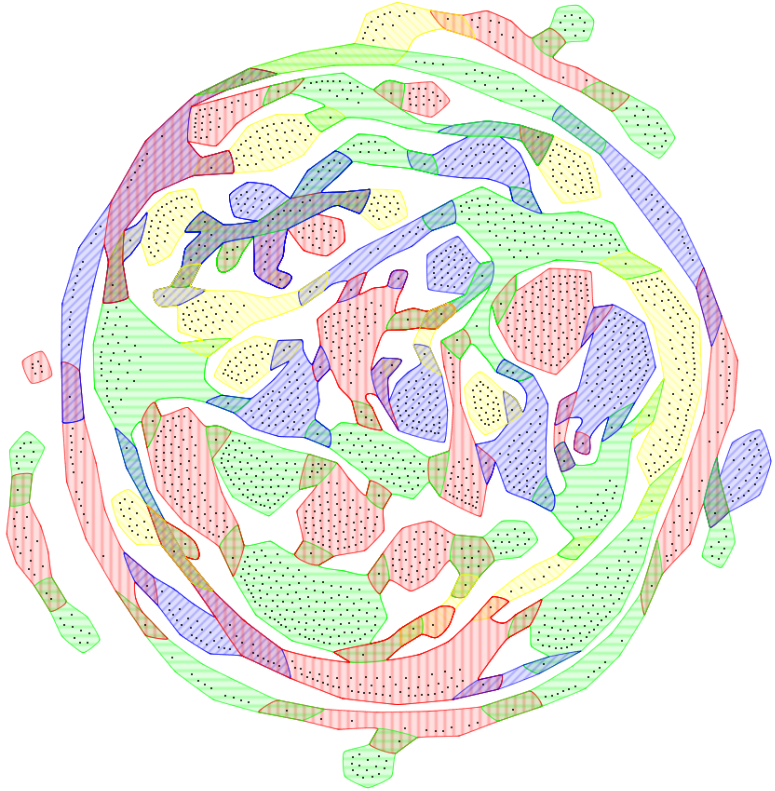
Visualisation of taxonomies and sets has recently become an active area of research. Many application fields now require more than a strict classification of elements into a hierarchy tree. Euler diagrams, one of the most natural ways of depicting intersecting sets, may provide a solution to these problems. In this paper, we present an approach for the automatic generation of Euler-like diagrams. This algorithm differs from previous approaches in that it has no undrawable instances of input, allowing it to be used in systems where the output is always required. We also improve the readability of Euler diagrams through the use of Bezier curves and transparent coloured textures. Our approach has been implemented using the Tulip platform. Both the source and executable program used to generate the results are freely available.
Efficient drawing and comparison of RNA secondary structure
David Auber, Maylis Delest, Serge Dulucq, Jean-Philippe Domenger
Journal of Graph Algorithms and Applications (2006)
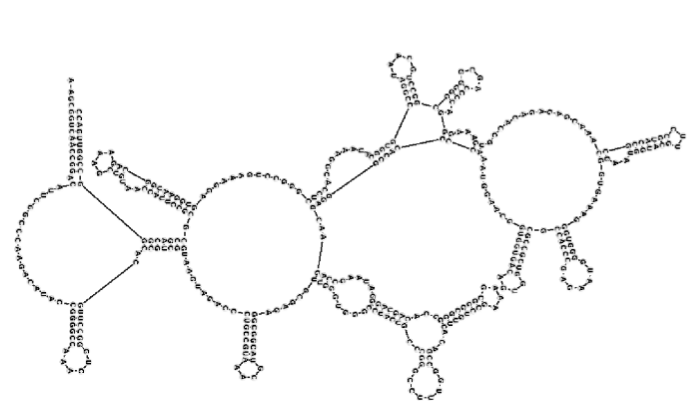
In this paper, we propose a new layout algorithm that draws the secondary structure of a Ribonucleic Acid (RNA) automatically according to some of the biologists’ aesthetic criteria. Such layout insures that two equivalent structures (or sub-structures) are drawn in a same and planar way. In order to allow a visual comparison of two RNAs, we use an heuristic that places the biggest similar part of the two structures in the same position and orientation.
Multiscale Visualization of Small World Networks
David Auber, Yves Chiricota, Fabien Jourdan, Guy Melançon
IEEE Symposition on Information Visualisation, (2003)
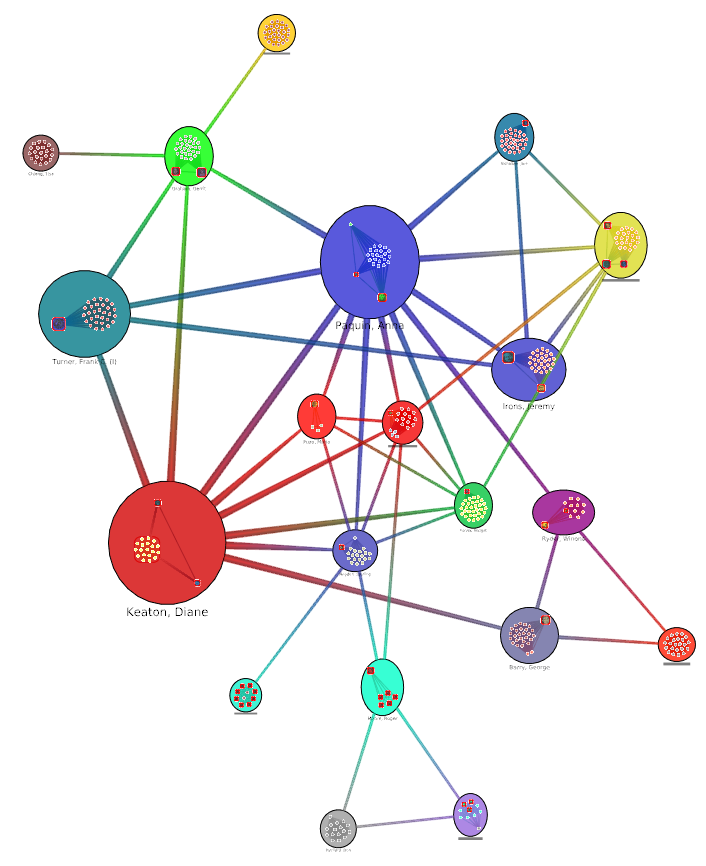
Many networks under study in Information Visualization are “small world” networks. These networks first appeared in the study social networks and were shown to be relevant models in
other application domains such as software reverse engineering and biology. Furthermore, many of these networks actually have a multiscale nature: they can be viewed as a network of groups that are themselves small world networks. We describe a metric that has been designed in order to identify the weakest edges in a small world network leading to an easy and low cost filtering procedure that breaks up a graph into smaller and highly connected components. We show how this metric can be exploited through an interactive navigation of the network based on semantic zooming. Once the network is decomposed into a hierarchy of
sub-networks, a user can easily find groups and subgroups of actors and understand their dynamics.
Tulip - A Huge Graph Visualization Framework
David Auber
Graph Drawing Software. Mathematics and Visualization. Springer (2004)
This chapter presents some of the direct applications of the Tulip framework in research and bioinformatics. Then, it introduces different kinds of algorithms implemented in Tulip such as graph drawing, graph parameters and graph clustering. Subsequently, we will describe the general functioning of the Tulip data structure that enables the management of a graph hierarchy and the manipulation of algorithms; we will also give a short description of the Tulip software functioning. Finally, after giving several examples of graph drawing results obtained on real graphs, which come from file-systems, web sites and program analysis, we will conclude with general information about the terms of use of the framework.


