Publications

A. Halnaut, R. Giot, R. Bourqui, D. Auber. Deep Dive into Deep Neural Networks with Flows. Proceedings of the 15th International Joint Conference on Computer Vision, Imaging and Computer Graphics Theory and Applications (VISIGRAPP 2020): IVAPP, Feb 2020, Valletta, Malta. pp.231-239.
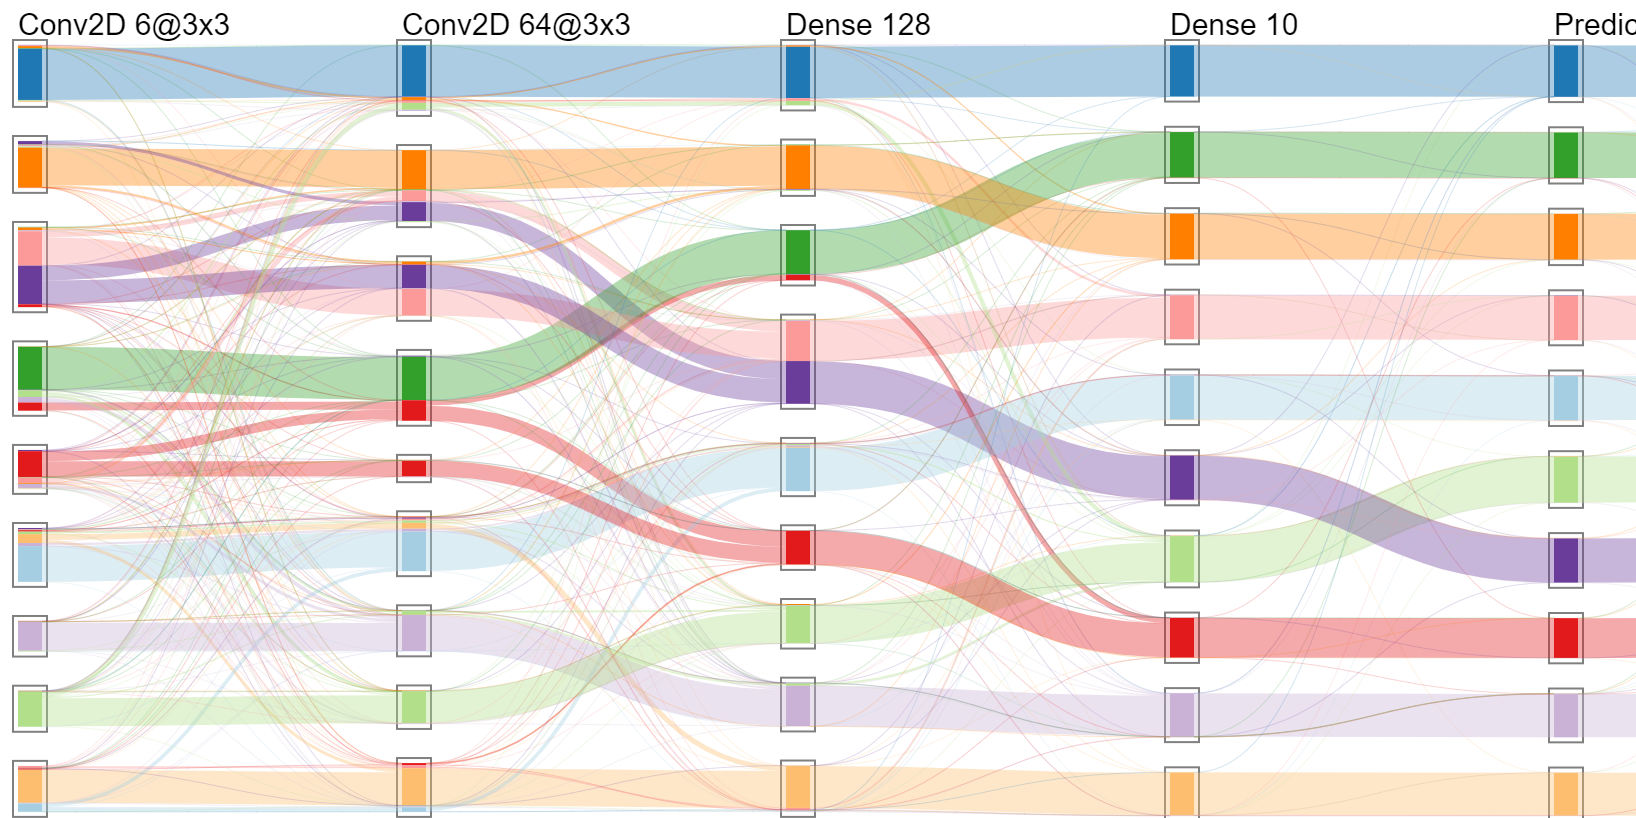
Deep neural networks are becoming omnipresent in reason of their growing popularity in media and their daily use. However, their global complexity makes them hard to understand which emphasizes their black-box aspect and the lack of confidence given by their potential users. The use of tailored visual and interactive representations is one way to improve their explainability and trustworthy. Inspired by parallel coordinates and Sankey diagrams, this paper proposes a novel visual representation allowing tracing the progressive classification of a trained classification neural network by examining how each evaluation data is being processed by each network's layer. It is thus possible to observe which data classes are quickly recognized, unstable, or lately recognized. Such information provides insights to the user about the model architecture's pertinence and can guide on its improvement. The method has been validated on two classification neural networks inspired from the literature (LeNet5 and VGG16) using two public databases (MNIST and FashionMNIST).

A. Halnaut, R. Giot, R. Bourqui, D. Auber. Samples Classification Analysis Across DNN Layers with Fractal Curves. ICPR 2020's Workshop Explainable Deep Learning for AI, Jan 2021, Milano (virtual), Italy.
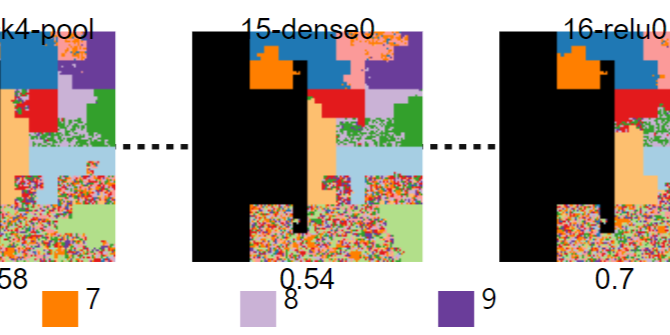
Deep Neural Networks are becoming the prominent solution when using machine learning models. However, they suffer from a blackbox effect that renders complicated their inner workings interpretation and thus the understanding of their successes and failures. Information visualization is one way among others to help in their interpretability and hypothesis deduction. This paper presents a novel way to visualize a trained DNN to depict at the same time its architecture and its way of treating the classes of a test dataset at the layer level. In this way, it is possible to visually detect where the DNN starts to be able to discriminate the classes or where it could decrease its separation ability (and thus detect an oversized network). We have implemented the approach and validated it using several well-known datasets and networks. Results show the approach is promising and deserves further studies.

A. Halnaut, R. Giot, R. Bourqui, D. Auber. VRGrid: Efficient Transformation of 2D Data into Pixel Grid Layout. 26th International Conference Information Visualisation, Jul 2022, Vienna, Austria.
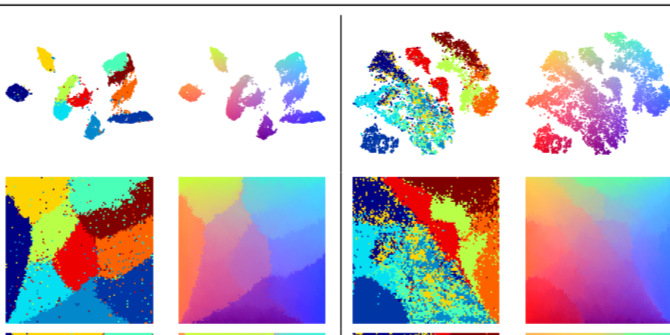
Projecting a set of n points on a grid of size √(n).√(n) provides the best possible information density in two dimensions without overlap. We leverage the Voronoi Relaxation method to devise a novel and versatile post-processing algorithm called VRGrid: it enables the arrangement of any 2D data on a grid while preserving its initial positions. We apply VRGrid to generate compact and overlap-free visualization of popular and overlap-prone projection methods (e.g., t-SNE). We prove that our method complexity is O (√(n).i.n.log(n)), with i a determined maximum number of iterations and n the input dataset size. It is thus usable for visualization of several thousands of points. We evaluate VRGrid's efficiency with several metrics: distance preservation (DP), neighborhood preservation (NP), pairwise relative positioning preservation (RPP) and global positioning preservation (GPP). We benchmark VRGrid against two stateof-the-art methods: Self-Sorting Maps (SSM) and Distancepreserving Grid (DGrid). VRGrid outperforms these two methods, given enough iterations, on DP, RPP and GPP which we identify to be the key metrics to preserve the positions of the original set of points.