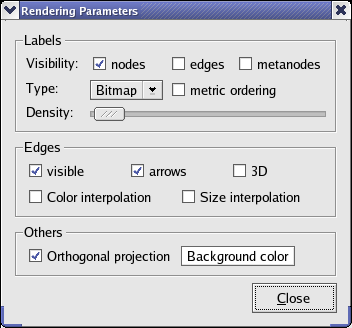
All actions in this dialog are just performed for the current view window.

This dialog is diaplayed when clicking on the Dialogs->Rendering Parameters(Ctrl+R). Ienables to configure the rendering of the graph. The available options are grouped in the following three frames:
Labels: the options in this frame only affect the display of the labels:Visibility: you can enable/disable the display of labels on nodes, edges or metanodes.Type: this indicates the text display mode which can be one of Bitmap, Texture or 3D.metric ordering: when checked the labels are displayed in using the viewMetric property decreasing order.Density: use this slider to avoid having too much labels displayed (max is on the left).
Edges: this frame options affect the way the edges are displayed:visible: enables/disables the display of edges. If not checked, the other options of this frame are not active.arrows: enables/disables the display of arrows.3D: enables/disables the display of edges in 3D.Color interpolation: when checked the edge color is interpolated from the color of its source node to the color of its target node.Size interpolation: when checked the edge size is interpolated from the size of its source node to the size of its target node.
Others: the options in this frame are related to general aspects of the rendering:Orthogonal projection: enables/disables the orthogonal projection. If not checked, the perpsective projection is used.Background color: enables to choose a color for the background of a graph view.